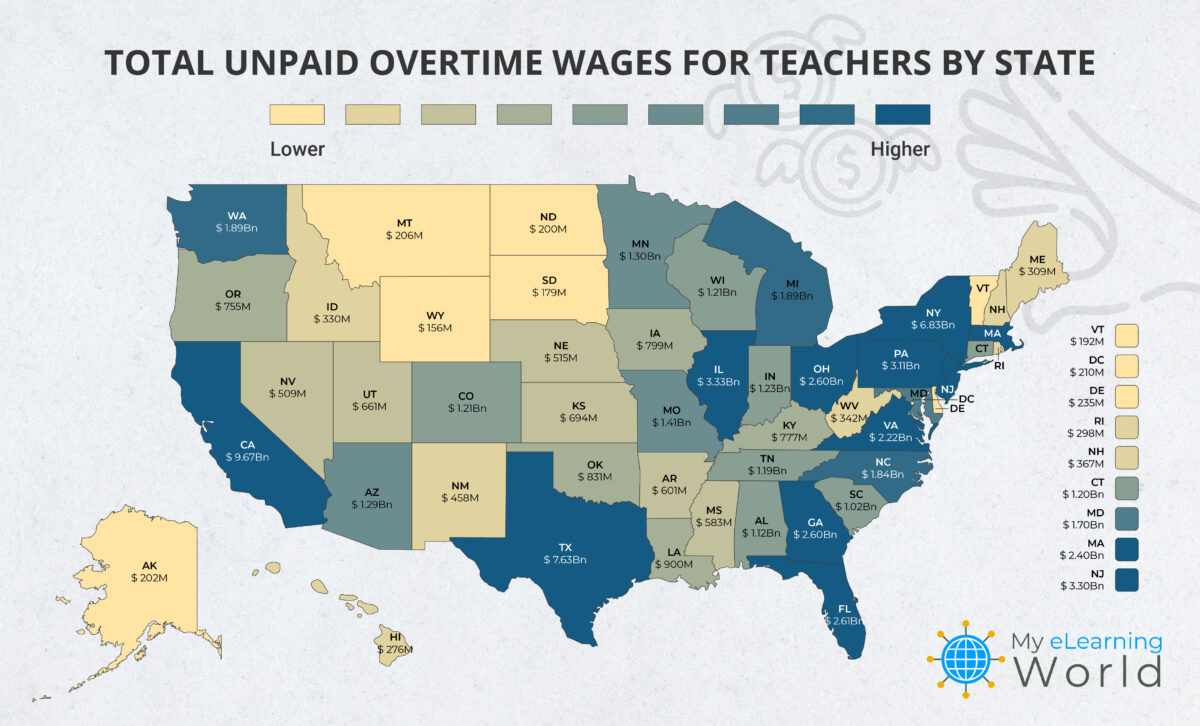
It’s often been said that teachers are overworked and underpaid, but our latest research puts the situation into startling financial perspective.
If US teachers were compensated for their unpaid overtime, they would collectively earn an additional $77.5 billion.
Our analysis found that the average US teacher works 540 hours more than their contracted amount. In total, that’s 1.74 billion hours of unpaid overtime that teachers are putting in across the country without being paid for it.
This figure underscores the immense value of the countless extra hours educators dedicate to nurturing the future of our society, often without financial recognition.
Our Methodology
Here’s how we uncovered that teachers long working hours account for $77.5 billion in unpaid overtime wages…
The average teacher contract is for 39 weeks each year.
This means at a full-time workload of 40 hours per week, teachers should only be working 1,560 hours per year. However, data shows that teachers work an average of more than 53 hours per week for a total of 2,100 hours per year.
If teachers worked the amount they were contracted for, they would average $42 per hour worked. However, as we recently reported, teachers are only earning an average of $31 per hour they work.
With that in mind, we know that teachers are working 540 hours of overtime beyond their contracted amount each year. At a contracted amount of $42 an hour, that means the average teacher has nearly $23,000 in unpaid overtime wages.
And with more than 3.2 million public school teachers across the United States, that brings the total of unpaid overtime wages to a whopping $77.5 billion.
Unpaid Teacher Overtime Wages by State
The numbers below are based on current average teacher pay in each respective state according to the National Education Association, the number of employed teachers in each state, and average US teacher workloads (53+ hours per week).

| State | Unpaid Overtime (per teacher) | Total Unpaid Overtime |
| Alabama | $24,073 | $1,118,211,350 |
| Alaska | $26,436 | $202,632,824 |
| Arizona | $20,864 | $1,294,533,130 |
| Arkansas | $18,799 | $601,144,232 |
| California | $32,940 | $9,671,809,860 |
| Colorado | $21,038 | $1,210,623,975 |
| Connecticut | $28,869 | $1,203,529,362 |
| Delaware | $23,811 | $234,965,809 |
| District of Columbia | $29,382 | $209,994,803 |
| Florida | $18,380 | $2,619,657,224 |
| Georgia | $22,313 | $2,608,394,531 |
| Hawaii | $24,559 | $276,406,783 |
| Idaho | $19,511 | $330,496,178 |
| Illinois | $25,586 | $3,336,173,074 |
| Indiana | $19,736 | $1,227,636,016 |
| Iowa | $21,195 | $799,170,527 |
| Kansas | $19,551 | $694,553,374 |
| Kentucky | $19,487 | $777,125,141 |
| Louisiana | $18,778 | $900,187,139 |
| Maine | $20,757 | $309,421,159 |
| Maryland | $27,492 | $1,705,575,046 |
| Massachusetts | $31,952 | $2,401,288,499 |
| Michigan | $23,196 | $1,895,679,334 |
| Minnesota | $24,233 | $1,301,939,528 |
| Mississippi | $18,469 | $583,629,146 |
| Missouri | $18,692 | $1,410,607,569 |
| Montana | $19,353 | $206,807,391 |
| Nebraska | $20,341 | $515,116,458 |
| Nevada | $21,364 | $509,901,014 |
| New Hampshire | $22,212 | $367,836,452 |
| New Jersey | $28,074 | $3,309,476,286 |
| New Mexico | $22,008 | $458,216,169 |
| New York | $32,087 | $6,827,391,966 |
| North Carolina | $19,578 | $1,838,835,331 |
| North Dakota | $19,659 | $200,008,318 |
| Ohio | $22,981 | $2,604,385,222 |
| Oklahoma | $19,213 | $831,550,292 |
| Oregon | $25,088 | $755,043,818 |
| Pennsylvania | $25,943 | $3,112,140,128 |
| Rhode Island | $27,446 | $298,285,218 |
| South Carolina | $20,000 | $1,020,823,926 |
| South Dakota | $18,399 | $179,575,366 |
| Tennessee | $19,166 | $1,188,648,915 |
| Texas | $21,017 | $7,633,297,253 |
| Utah | $21,974 | $661,577,008 |
| Vermont | $23,032 | $191,646,712 |
| Virginia | $21,843 | $2,223,368,675 |
| Washington | $30,048 | $1,895,158,346 |
| West Virginia | $18,301 | $342,176,673 |
| Wisconsin | $21,643 | $1,211,137,975 |
| Wyoming | $21,454 | $156,251,443 |
- Elevating Your Virtual Presence: Why EMEET’s SmartCam S800 Stands Out in Modern Communication - 06/04/2025
- US Teachers Will Spend $3.35 Billion of Their Own Money on Classroom Expenses in 2025-25 School Year - 06/04/2025
- Report: Leveraging AI Tools Could Help US Teachers Avoid $43.4 Billion of Unpaid Overtime Work - 06/04/2025

