It wasn’t all that long ago that a student could pay his or her own way through school by working a part-time minimum wage job on the side, but thanks to rapidly rising tuition and fees, those days are long gone.
Consider this: 30 years ago, the average student at a public university could pay for a full year of tuition by working around 500 hours at a minimum wage job — a little less than 10 hours per week throughout the year (source: National Center for Education Statistics).
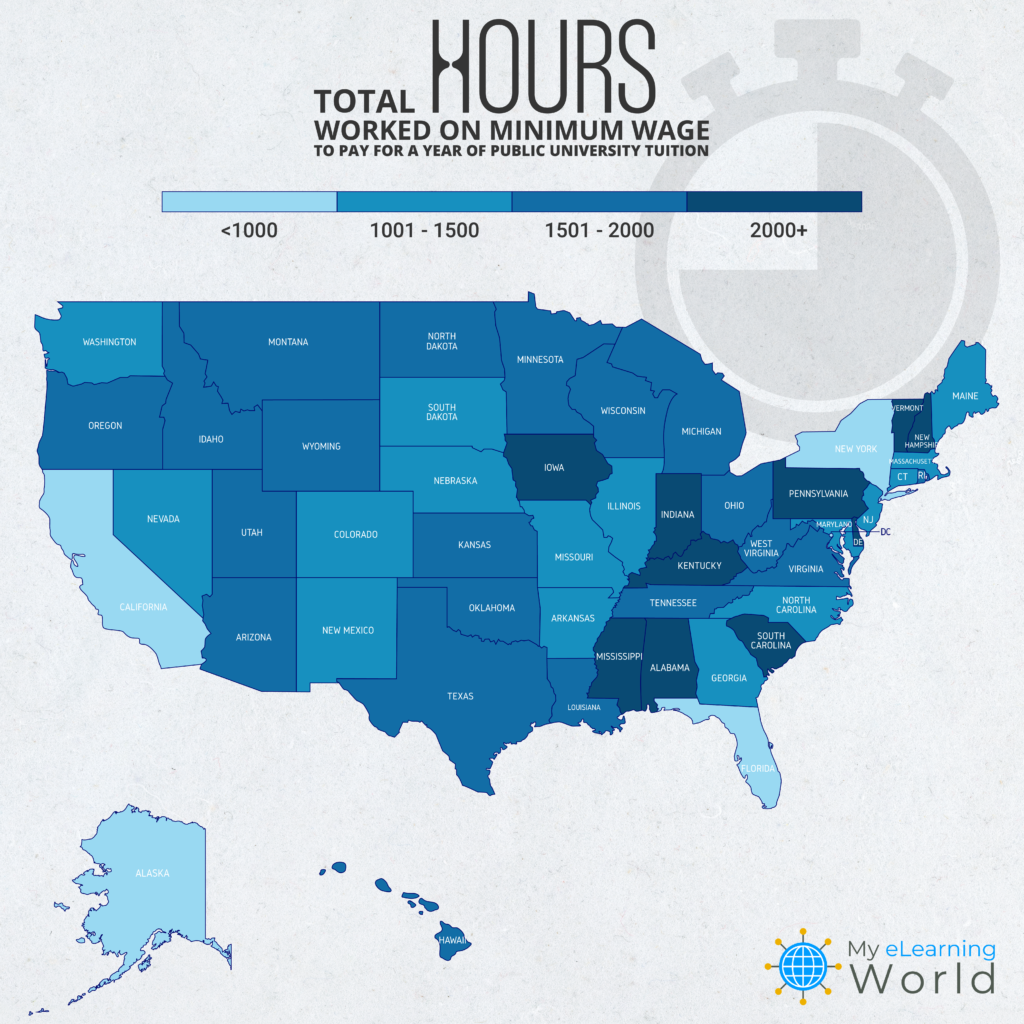
Today, our analysis finds the same student would have to work 2,022 hours on average at a minimum wage job to cover a year of tuition at a public university — about 39 hours each week, all year long. And in some states, he or she would have to work even more than that.

In other words, the average college student in 2023 has to work about 4x as many hours on minimum wage as a student 30 years ago to access the same education.
But it gets worse. Students who want to attend a private university would have to work about 4,646 hours on average at a minimum wage job to cover a year of tuition — around 89 hours each week, every week of the year.
And really, these estimates are very conservative. They assume a student has no other expenses to pay for (e.g. books, room and board, food, entertainment, etc.) and don’t factor in the various taxes that come out of the typical paycheck. Things would look even more dismaying if all of those numbers were also tabulated.
Yet many people still hold the antiquated belief that it’s easy to work your way through college. These numbers paint a very different picture.
To further understand just how hard it is for students to pay for college without taking out a loan or receiving other aid, we did a full state-by-state breakdown of average public university tuition and fees (weighted to account for the percentage of in-state and out-of-state students in each state) and current local minimum wages.
The results are eye-opening, to say the least.
Key Findings
- While public and private college tuition rates have increased at several times the rate of inflation over the last 30 years, the minimum wage hasn’t even kept pace with inflation.
- There are 9 states where a student would have to work more than 40 hours per week, 52 weeks per year at minimum wage just to cover the cost of tuition and fees.
- In 28 states, a student would need to work 30+ hours a week, every week of the year to afford the average tuition.
- The average student attending college today has to work about 4x as many hours on minimum wage as a student 30 years ago to pay for school.
State-by-State Breakdown (Raw Data)
| State | 2022-23 In-State Tuition and Fees | 2022-23 Out-of-State Tuition and Fees | Percent In-State Students | Weighted Annual Tuition | Minimum Wage | Total Hours of Work to Pay Annual Tuition | Weekly Hours of Work Needed to Pay for School |
| Alabama | $11,620 | $29,200 | 59.6% | $18,722 | $7.25 | 2,582.39 | 49.66 |
| Alaska | $8,990 | $26,820 | 92.0% | $10,416 | $10.85 | 960.04 | 18.46 |
| Arizona | $12,180 | $32,870 | 57.9% | $20,890 | $13.85 | 1,508.34 | 29.01 |
| Arkansas | $9,460 | $23,800 | 71.8% | $13,504 | $11 | 1,227.63 | 23.61 |
| California | $10,250 | $33,590 | 88.9% | $12,841 | $15.50 | 828.43 | 15.93 |
| Colorado | $12,100 | $33,820 | 72.8% | $18,008 | $13.65 | 1,319.26 | 25.37 |
| Connecticut | $15,610 | $34,220 | 82.0% | $18,960 | $14 | 1,354.27 | 26.04 |
| Delaware | $14,230 | $34,960 | 36.8% | $27,331 | $11.75 | 2,326.07 | 44.73 |
| District of Columbia | $8,640 | $8,640 | NA | $8,640 | $15.20 | 568.42 | 10.93 |
| Florida | $6,370 | $22,010 | 84.7% | $8,763 | $11 | 796.63 | 15.32 |
| Georgia | $8,220 | $25,380 | 87.1% | $10,434 | $7.25 | 1,439.12 | 27.68 |
| Hawaii | $11,000 | $31,690 | 70.8% | $17,041 | $10.10 | 1,687.28 | 32.45 |
| Idaho | $8,180 | $25,740 | 69.2% | $13,588 | $7.25 | 1,874.27 | 36.04 |
| Illinois | $14,960 | $25,210 | 86.3% | $16,364 | $13 | 1,258.79 | 24.21 |
| Indiana | $10,040 | $30,650 | 73.1% | $15,584 | $7.25 | 2,149.53 | 41.34 |
| Iowa | $10,110 | $28,590 | 57.6% | $17,946 | $7.25 | 2,475.24 | 47.60 |
| Kansas | $9,390 | $23,800 | 71.1% | $13,554 | $7.25 | 1,869.58 | 35.95 |
| Kentucky | $11,390 | $25,530 | 72.9% | $15,222 | $7.25 | 2,099.58 | 40.38 |
| Louisiana | $10,160 | $22,700 | 86.9% | $11,803 | $7.25 | 1,627.96 | 31.31 |
| Maine | $11,210 | $29,670 | 68.0% | $17,117 | $13.80 | 1,240.38 | 23.85 |
| Maryland | $10,560 | $25,860 | 73.8% | $14,569 | $13.25 | 1,099.52 | 21.14 |
| Massachusetts | $14,400 | $31,840 | 84.1% | $17,173 | $15 | 1,144.86 | 22.02 |
| Michigan | $14,810 | $38,680 | 79.8% | $19,632 | $10.10 | 1,943.74 | 37.38 |
| Minnesota | $12,910 | $25,730 | 74.2% | $16,218 | $10.59 | 1,531.40 | 29.45 |
| Mississippi | $9,100 | $20,740 | 53.0% | $14,571 | $7.25 | 2,009.77 | 38.65 |
| Missouri | $10,240 | $23,660 | 76.1% | $13,447 | $12 | 1,120.62 | 21.55 |
| Montana | $7,460 | $27,890 | 60.3% | $15,571 | $9.95 | 1,564.90 | 30.09 |
| Nebraska | $9,140 | $22,620 | 75.7% | $12,416 | $10.50 | 1,182.44 | 22.74 |
| Nevada | $8,590 | $24,930 | 76.5% | $12,430 | $9.50 | 1,308.41 | 25.16 |
| New Hampshire | $17,020 | $32,740 | 42.9% | $25,996 | $7.25 | 3,585.67 | 68.96 |
| New Jersey | $15,440 | $28,660 | 90.1% | $16,749 | $14.13 | 1,185.33 | 22.79 |
| New Mexico | $8,930 | $23,980 | 79.3% | $12,045 | $12 | 1,003.78 | 19.30 |
| New York | $8,560 | $21,020 | 92.1% | $9,544 | $14.20 | 672.14 | 12.93 |
| North Carolina | $7,360 | $23,990 | 86.8% | $9,555 | $7.25 | 1,317.95 | 25.35 |
| North Dakota | $10,470 | $14,800 | 40.1% | $13,064 | $7.25 | 1,801.89 | 34.65 |
| Ohio | $12,560 | $27,730 | 79.3% | $15,700 | $10.10 | 1,554.47 | 29.89 |
| Oklahoma | $9,390 | $23,460 | 70.1% | $13,597 | $7.25 | 1,875.44 | 36.07 |
| Oregon | $12,880 | $35,730 | 60.9% | $21,814 | $13.50 | 1,615.88 | 31.07 |
| Pennsylvania | $15,550 | $29,710 | 74.0% | $19,232 | $7.25 | 2,652.63 | 51.01 |
| Rhode Island | $14,570 | $32,760 | 52.9% | $23,137 | $13 | 1,779.81 | 34.23 |
| South Carolina | $13,120 | $34,170 | 61.8% | $21,161 | $7.25 | 2,918.77 | 56.13 |
| South Dakota | $9,290 | $12,830 | 56.1% | $10,844 | $10.80 | 1,004.08 | 19.31 |
| Tennessee | $10,570 | $25,020 | 85.2% | $12,709 | $7.25 | 1,752.91 | 33.71 |
| Texas | $11,140 | $28,340 | 94.0% | $12,172 | $7.25 | 1,678.90 | 32.29 |
| United States (National Average) | $10,940 | $28,230 | 78.5% | $14,657 | $7.25 | 2,021.70 | 38.88 |
| Utah | $7,660 | $24,050 | 76.1% | $11,577 | $7.25 | 1,596.86 | 30.71 |
| Vermont | $17,650 | $41,980 | 33.4% | $33,854 | $13.18 | 2,568.57 | 49.40 |
| Virginia | $14,580 | $36,930 | 77.9% | $19,519 | $12 | 1,626.61 | 31.28 |
| Washington | $11,130 | $33,940 | 79.3% | $15,852 | $15.74 | 1,007.09 | 19.37 |
| West Virginia | $8,940 | $23,670 | 62.5% | $14,464 | $8.75 | 1,653.00 | 31.79 |
| Wisconsin | $9,230 | $26,460 | 71.8% | $14,089 | $7.25 | 1,943.29 | 37.37 |
| Wyoming | $6,440 | $21,590 | 51.2% | $13,833 | $7.25 | 1,908.03 | 36.69 |


Scott is also a contributor to numerous top industry publications, including eLearning Industry and the TalentLMS Blog, as well as a trusted expert source whose analysis has been quoted and referenced in the LA Times, Fox Business, Houston Chronicle, NEA Today, and others.