Summer is upon us, and as another school year comes to an end, a fresh crop of college graduates are still excitedly celebrating their accomplishments. But before long, these graduates’ mailboxes will be filled with the dreaded notice that their student loan payments are due.
Today’s typical new college graduate leaves school with around $31,100 in student loan debt. That number has steadily increased over the years as the cost of college continues to skyrocket out of control (see our previous report where we found the cost of attending college has increased at 5x the rate of inflation).
While some of these new graduates will undoubtedly land great jobs and be able to start paying off their loans, the reality is many of them will struggle to make the required payments. And as time goes on and interest adds up, many of these new graduates may soon find themselves in a situation faced by tens of millions of other Americans right now where they simply can’t afford to pay off their loans.
Student loan forgiveness has been a hot topic in the news as the Biden administration reportedly has been considering forgiving $10,000 of debt for qualifying borrowers (those who earn less than $150,000 per year, or less than $300,000 annually for married couples filing jointly).
The current pause on federal student loan payments that was enacted at the start of the COVID-19 pandemic is set to come to an end in August, making it more likely that an official decision on the issue will be made later this summer.
While those in DC will continue to debate the social and economic consequences of student loan forgiveness in the coming weeks, we wanted to get a feel for what level of interest there is across the country for it.
Is the demand for student loan forgiveness something that’s consistent all across the United States? Or is it more prevalent in some regions of the country than others?
We partnered with Mindnet Analytics, a data science consulting firm, to compare interest in student loan forgiveness across all 50 states, combining search trends with publicly available demographic data.
Here’s what we found…
Overview
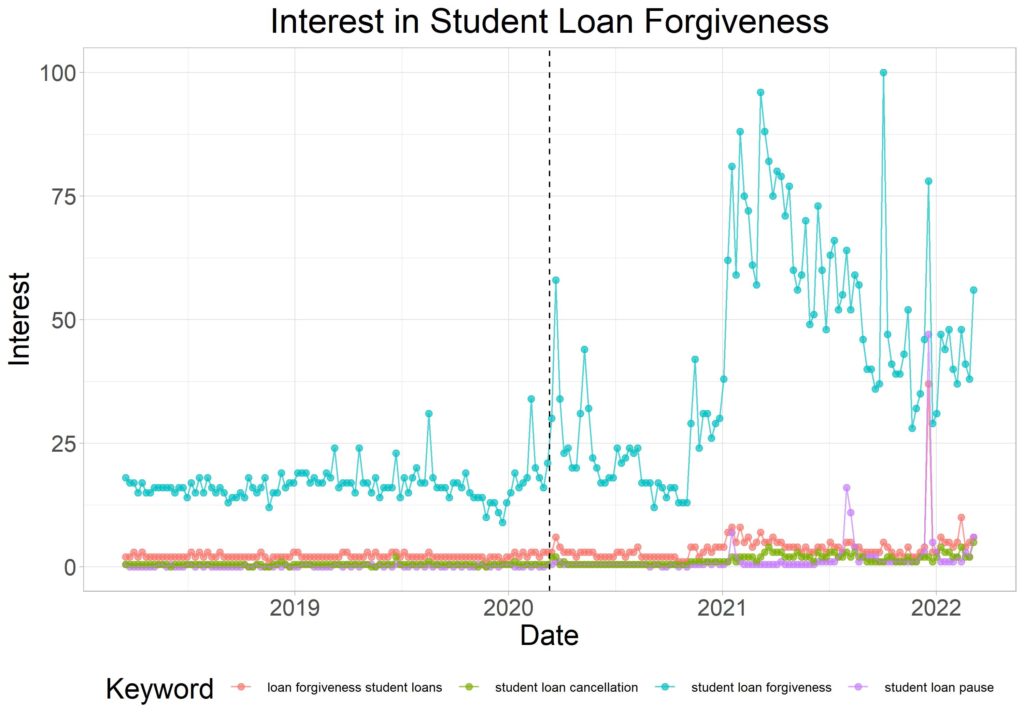
Search interest in student loan forgiveness has drastically increased in recent times:
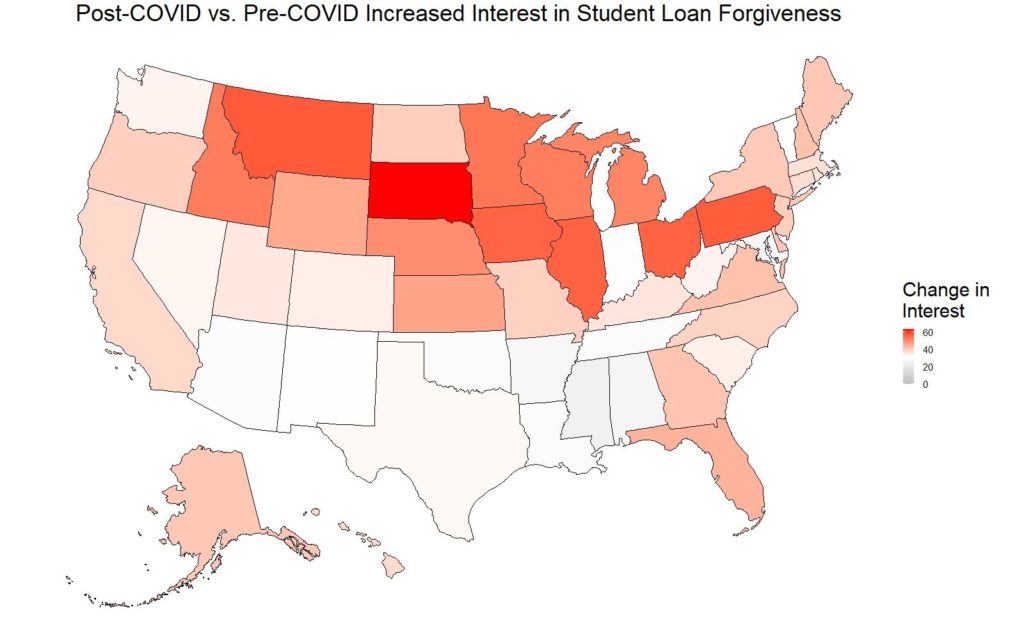
In the graph directly below, you can see the increase in search interest in student loan forgiveness before COVID and after COVID in each US state. Some states have seen a sharper increase in interest in student loan forgiveness than others:
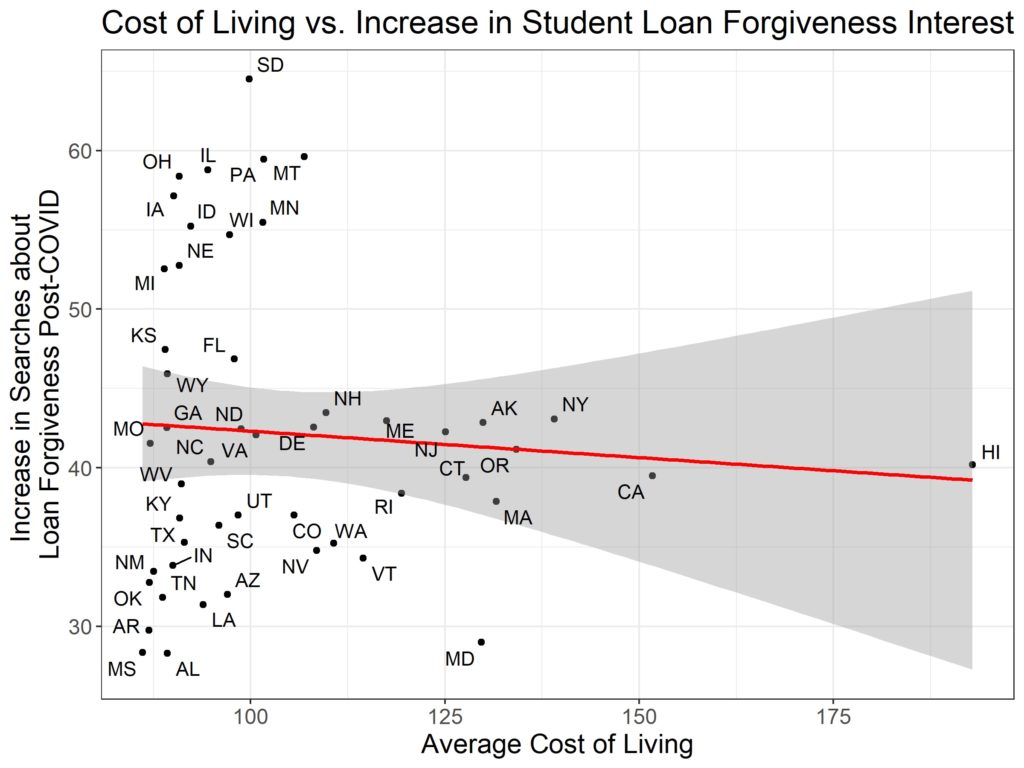
While we expected states with a higher cost of living to see the greatest increase in interest around student loan forgiveness, our analysis did not find an association between the two metrics:
State Rankings of Student Loan Forgiveness Interest
We calculated the increase in interest in student loan forgiveness for each state by subtracting the interest before COVID from the interest after COVID. These results are shown below and can be found in the table below:

| Location | Increase in Interest |
| South Dakota | 63.7 |
| Montana | 57.4 |
| Pennsylvania | 57.1 |
| Illinois | 56.4 |
| Ohio | 56.4 |
| Iowa | 56.1 |
| Minnesota | 53.7 |
| Idaho | 52.8 |
| Wisconsin | 52.7 |
| Michigan | 51.5 |
| Nebraska | 50.4 |
| Kansas | 46.8 |
| Wyoming | 45.9 |
| Florida | 44.5 |
| New Hampshire | 42.1 |
| Virginia | 42.1 |
| Georgia | 41.5 |
| Alaska | 41.1 |
| Delaware | 41.1 |
| Maine | 40.9 |
| New York | 40.7 |
| District of Columbia | 40.4 |
| New Jersey | 39.9 |
| North Dakota | 39.9 |
| Oregon | 39.7 |
| Missouri | 39.5 |
| North Carolina | 39 |
| California | 38.1 |
| Hawaii | 38 |
| Connecticut | 37.6 |
| Massachusetts | 36.9 |
| Rhode Island | 36.4 |
| Kentucky | 36.2 |
| Utah | 35.6 |
| Colorado | 34.6 |
| South Carolina | 34.4 |
| Washington | 33.9 |
| West Virginia | 33.8 |
| Nevada | 33.4 |
| Texas | 32.9 |
| New Mexico | 32.1 |
| Vermont | 31.7 |
| Indiana | 31 |
| Arizona | 30.2 |
| Louisiana | 30 |
| Oklahoma | 30 |
| Tennessee | 30 |
| Arkansas | 27.9 |
| Maryland | 27.6 |
| Alabama | 27.3 |
| Mississippi | 24.9 |
Increase in Student Loan Forgiveness by Metro Area
We also calculated the increase in interest in student loan forgiveness for nearly 200 cities and towns across the country by subtracting the interest before COVID from the interest after COVID. These 50 metro areas have seen the biggest increase in interest for student loan forgiveness:
| City | Increase in Interest |
| Erie PA | 46.6 |
| Macon GA | 42.6 |
| Watertown NY | 40.8 |
| Parkersburg WV | 40.7 |
| Binghamton NY | 40.1 |
| Helena MT | 39.7 |
| Bangor ME | 35.7 |
| Wheeling WV-Steubenville OH | 32.4 |
| Montgomery (Selma) AL | 32.3 |
| Sioux Falls(Mitchell) SD | 32 |
| Quincy IL-Hannibal MO-Keokuk IA | 32 |
| Abilene-Sweetwater TX | 31.7 |
| Cheyenne WY-Scottsbluff NE | 31.7 |
| Jonesboro AR | 31.7 |
| Rochester NY | 31.7 |
| Jackson MS | 31.5 |
| Charleston-Huntington WV | 31.4 |
| Columbus OH | 31.4 |
| Monroe LA-El Dorado AR | 31.4 |
| Lexington KY | 31.3 |
| Elmira NY | 31.3 |
| Bluefield-Beckley-Oak Hill WV | 31.3 |
| Columbus-Tupelo-West Point MS | 31.2 |
| Columbus GA | 31.2 |
| Augusta GA | 31.1 |
| Duluth MN-Superior WI | 31 |
| Wichita Falls TX & Lawton OK | 31 |
| Jackson TN | 31 |
| Huntsville-Decatur (Florence) AL | 30.9 |
| Marquette MI | 30.8 |
| Biloxi-Gulfport MS | 30.6 |
| Albany GA | 30.5 |
| Charleston SC | 30.4 |
| Buffalo NY | 30.4 |
| Toledo OH | 30.4 |
| Birmingham AL | 30.4 |
| Ft. Wayne IN | 30.4 |
| Rochester MN-Mason City IA-Austin MN | 30.4 |
| Youngstown OH | 30.3 |
| Syracuse NY | 30.3 |
| Paducah KY-Cape Girardeau MO-Harrisburg-Mount Vernon IL | 30.3 |
| Baton Rouge LA | 30.3 |
| Bowling Green KY | 30.1 |
| Memphis TN | 30.1 |
| Little Rock-Pine Bluff AR | 30.1 |
| Flint-Saginaw-Bay City MI | 30.1 |
| Indianapolis IN | 29.9 |
| Shreveport LA | 29.9 |
| Hattiesburg-Laurel MS | 29.9 |
Methodology
We extracted the frequency of searches in each state about student loan forgiveness using relevant search phrases. We then examined the differences in search frequencies for these keywords two years before COVID versus two years after the start COVID.
We controlled for seasonal changes in loan forgiveness interest by comparing a full two years before COVID to a full two years after. We used March 11, 2020 as the official start of COVID-19 as this is when it was declared a pandemic in the US.
We report the amounts searches increased in each state and city after COVID-19 began. We also examined the relationship between these trends and local cost of living in each state.
Scott is also a contributor to numerous top industry publications, including eLearning Industry and the TalentLMS Blog, as well as a trusted expert source whose analysis has been quoted and referenced in the LA Times, Fox Business, Houston Chronicle, NEA Today, and others.