Data has become the backbone of decision-making in today’s organizations. From designing smarter business strategies to streamlining operations and improving customer experiences, companies now rely on professionals who can not only handle data but also extract meaningful insights from it. Yet, for many, the challenge lies in moving beyond theory to actually applying data science and analytics tools in ways that solve real problems at work.
That’s where Great Learning’s Academy Pro+ makes a difference. With a catalogue of 500+ short courses and 30+ in-depth Pro programs, it combines flexibility with real-world application. Learners don’t just watch lectures; they actively practice through 50+ guided projects that mirror business challenges and 200+ coding exercises that strengthen technical fluency. To support career growth, Academy Pro+ also includes AI-led mock interviews that sharpen problem-solving under pressure, along with an AI-powered resume builder that highlights new skills in ways employers value.
The formats are designed for busy professionals, with everything from 1–3 hour focused modules to sharpen specific skills, to 15–20 hour programs for deeper expertise. What sets it apart is the AI Mentor, available 24/7 to resolve doubts, provide intelligent coding hints, and keep learners progressing without feeling stuck. By combining flexible schedules, hands-on practice, and personalized AI support, Academy Pro+ turns data upskilling into a practical, outcomes-driven experience, helping professionals gain confidence, sharpen analytical skills, and deliver measurable impact in their careers.
1. Master Data Analytics in SQL & Excel

Data analysis often starts with the tools that can process and organize information efficiently. This 8.5-hour course provides practical mastery in SQL and Excel, empowering professionals to extract, manipulate, and analyze data effectively.
Key highlights of this program include:
- Gain proficiency in writing SQL queries to efficiently retrieve, filter, and aggregate data.
- Leverage Excel functions, pivot tables, and charts to clean, summarize, and visualize datasets.
- Integrate SQL and Excel skills to manage complete data workflows for real-world business use cases.
- Strengthen expertise with 4 industry-aligned projects and 39 coding exercises, offering extensive hands-on practice with real datasets.
- Develop dashboards and reports that translate complex data into clear, actionable insights for stakeholders.
2. Data Visualization with Power BI

Numbers alone don’t drive decisions, insights do. This 7.5-hour program teaches you how to transform raw data into interactive dashboards and meaningful reports using Microsoft Power BI.
Some of the key benefits for the participants would be:
- Ability to clean, structure, and analyze complex datasets.
- Build visually compelling dashboards that highlight trends and insights.
- Use visualization best practices to tell persuasive stories with data.
- Work on a dedicated project that simulates real business challenges, ensuring practical experience beyond the classroom.
- Share insights in formats that drive decision-making across teams.
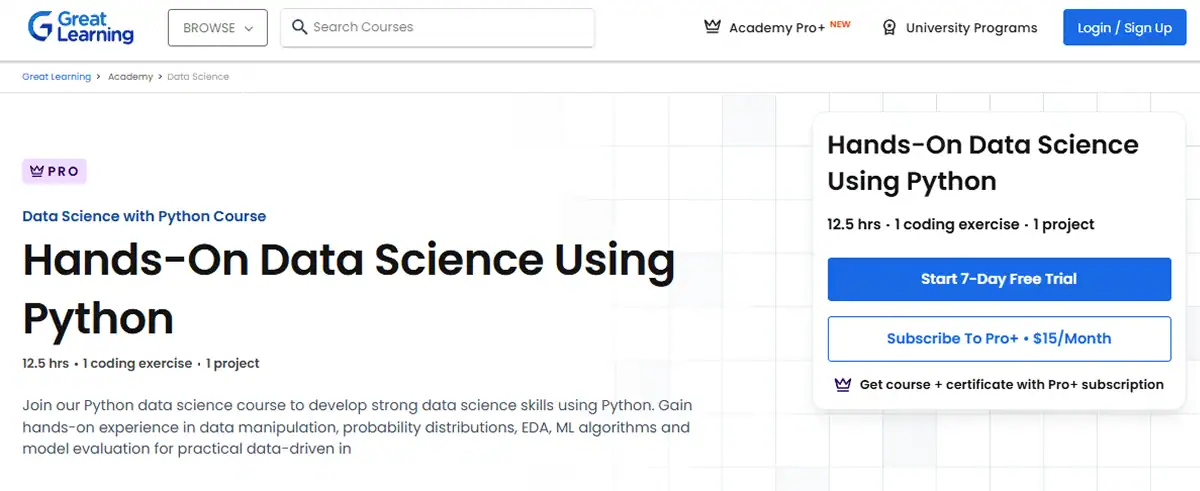
3. Hands-On Data Science Using Python

Python has become the backbone of data science, powering everything from machine learning models to large-scale analytics pipelines. This 12-hour course offers a structured and practical pathway to mastering Python’s most widely used libraries, including NumPy, Pandas, and scikit-learn. The program is designed not just to teach syntax, but to help professionals confidently solve real business problems with Python.
Key takeaways from this course include:
- Developing the ability to manipulate, clean, and analyze datasets using NumPy and Pandas.
- Applying machine learning workflows to solve classification, regression, and clustering problems on real-world datasets.
- Understanding how to build, train, and evaluate models effectively, while interpreting results with a business lens.
- Strengthening practical application through 1 industry-aligned project and 1 coding exercise, bridging the gap between coding practice and real-world problem-solving.
- Building familiarity with data visualization and evaluation techniques that make analysis more interpretable for decision-making.
By the end, learners come away with both the technical fluency and the applied problem-solving ability that employers look for in entry-level and mid-level data science roles.
4. Tableau Data Visualization Essentials

Data is only as powerful as the story it tells, and Tableau has emerged as a global standard for turning raw numbers into actionable insights. This 8.5-hour course equips professionals with the job-ready skills needed to translate complex datasets into interactive dashboards and compelling visual narratives that influence decisions across industries.
As part of this course, participants will:
- Learn to connect, clean, and structure datasets within Tableau for seamless analysis.
- Build dynamic, interactive dashboards that allow stakeholders to explore data visually.
- Apply filters, calculations, and parameters to uncover deeper insights and patterns in the data.
- Practice visualization best practices, ensuring that dashboards are not just informative but also clear, engaging, and free from clutter.
- Complete a real-world project that simulates workplace challenges, showcasing the ability to translate raw data into visual insights.
- Present findings in a way that makes insights accessible to both technical and non-technical stakeholders, strengthening communication impact.
The program emphasizes practical application, ensuring that learners don’t just know how to use Tableau but also understand how to tell persuasive stories with data — a critical skill in today’s data-driven organizations.
5. Statistics for Data Science & Analytics

Understanding data begins with strong statistical foundations. This 3.5-hour program equips learners with the key statistical concepts required to make data-driven decisions with confidence.
Key takeaways from this program:
- Build a strong foundation in core concepts such as probability, distributions, hypothesis testing, and statistical inference.
- Apply descriptive and inferential statistics to analyze and interpret real-world datasets.
- Conduct exploratory data analysis (EDA) to identify patterns, trends, and anomalies in data.
- Gain practical confidence by working on 3 industry-inspired projects and 40 exercises, tackling diverse statistical problems.
- Use statistical reasoning to validate insights, strengthen decision-making, and assess model performance effectively.
In recent years, data has shifted from being a back-office function to a front-line driver of business strategy. This change has redefined what it means to be skilled in a professional setting. It’s no longer enough to rely on instinct or experience alone, decisions today are expected to be backed by evidence, analysis, and clarity.
That’s why practical training in data tools and methods holds such value. Beyond the certificates and resumes, what matters is the confidence to take a messy dataset, extract what’s meaningful, and communicate it in a way that influences outcomes. Programs that prioritize hands-on projects and exercises don’t just teach techniques; they help professionals internalize a way of thinking that is critical in modern workplaces.
As businesses continue to double down on data-driven decision-making, the ability to translate numbers into narratives and insights into action will set professionals apart. Those who commit to building these skills today are, in effect, future-proofing their careers against a rapidly changing landscape.
- Xero Cloud Accounting: Is It Worth It? (2026 Update) - 01/20/2026
- QuickBooks Promo Code UK - 12/15/2025
- Great Learning vs Coursera: Which Platform Delivers Better Outcomes for Learners? - 10/15/2025


