If you’re involved in project management, chances are you’ve heard of a Gantt chart.
A Gantt chart is a graphical timeline tool that can be used to plan, track, and communicate project tasks, schedules, and dependencies.
Gantt charts are a popular project management tool because they’re easy to understand and can help you see at a glance whether your project is on track.
If you’ve never used a Gantt chart before, or if you’re looking for tips on how to get the most out of this valuable tool, this guide is for you.
We’ll cover everything you need to know about Gantt charts, including how to create one using a tool like Office Timeline, what to use it for, and some best practices for using Gantt charts in your projects.
What is a Gantt Chart?
A Gantt chart is a type of bar chart that illustrates a project schedule. Gantt charts are used to plan, coordinate, and track specific tasks over the course of a project.
The chart is named after American engineer Henry Gantt, who designed the first known version of the chart in the early 1900s.
Today, Gantt charts are widely used in project management and are considered an essential tool for tracking progress and ensuring that projects stay on schedule.
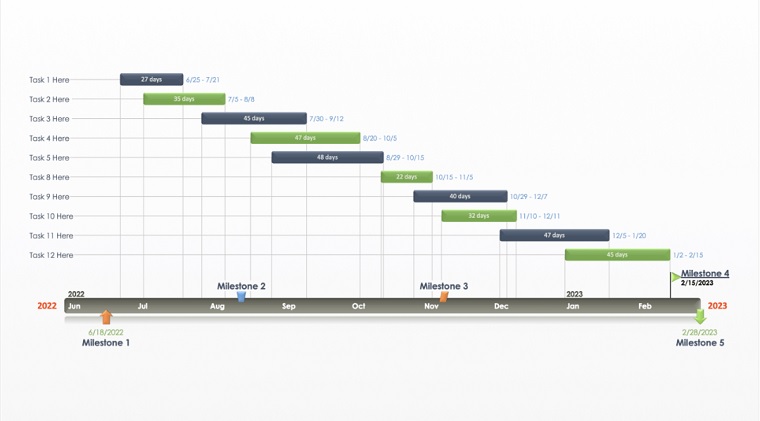
Gantt charts typically include a list of tasks along the left side of the chart, with each task represented by a bar. The length of each bar represents the amount of time required to complete the task.
Tasks can be arranged vertically or horizontally, and they can be color-coded to represent different phases or stages of a project.
In addition, Gantt charts often include milestones, which are special events or tasks that mark significant accomplishments or important deadlines.
Why Use Gantt Charts?
Creating a Gantt chart can help you better understand the work involved in a project and make sure that all necessary tasks are accounted for. It can be a great tool for brainstorming and for getting input from team members on task duration and dependencies.
It can also help you identify potential problems or bottlenecks so that you can take measures to prevent them.
Ultimately, a Gantt chart is an invaluable tool for ensuring that your project stays on track from start to finish.


6 Tips for Creating Gantt Charts
When it comes to building your own Gantt charts, there are a few things to keep in mind.
Here are some tips to help you create effective Gantt charts for your projects:
1. Define the scope of the project
Start by defining the scope of your project.
What are the main goals?
What tasks need to be completed in order to achieve those goals?
What are some milestones that you’ll want to hit along the way?
Be as specific as possible when defining the scope of your project so that you can create a Gantt chart that accurately reflects the work that needs to be done.
This will give you a good foundation to work from when you start creating your Gantt chart.
2. Estimate the time required for each task
Once you have your list of tasks, it’s time to start estimating how long each one will take.
Be realistic in your estimates, and allow for some wiggle room in case unexpected delays or problems arise.
If you’re not sure how long a task will take, ask someone who is familiar with the work involved.
It’s better to err on the side of caution than to underestimate the time required and end up behind schedule.
3. Determine task dependencies
In many projects, certain tasks need to be completed before others can begin.
These are called dependencies, and they’re important to consider when creating your Gantt chart.
For each task, ask yourself if there are any other tasks that need to be completed first.
If so, make a note of these dependencies on your Gantt chart. You can indicate dependencies by using arrows between the relevant tasks.
4. Build your Gantt chart
Once you have all of the tasks and dependencies mapped out, it’s time to create your timeline.
Start by deciding on a timeframe for your project.
Then, begin assigning dates to each task based on its estimated duration and its place in the overall sequence of tasks.
Be sure to leave some buffer time in case tasks take longer than expected or unforeseen delays occur.
With a tool like Office Timeline, you can quickly and easily create timelines and Gantt charts with just a few clicks.
Simply enter in your project information, and it can do the rest, creating a professional-looking timeline that you can share with your team or clients.
Office Timeline has tons of templates and themes to choose from, so you can find one that fits your project perfectly. It’s one of our favorite timeline makers out there today.
 Office Timeline
With Office Timeline, you can create stylish timelines and roadmaps in no time at all with just a few clicks. It's super easy to use and powerful enough to handle all your timeline design needs.
5. Assign resources
Once you have your timeline created, it’s time to start assigning resources to each task.
In most cases, this will be people, but it could also be equipment or other materials.
For each task, decide who will be responsible for completing it and make a note of this on your Gantt chart.
If you’re using Office Timeline, you can easily add people to your timeline to show who is working on each task.
6. Update your chart as the project progresses
As your project moves forward, be sure to keep your Gantt chart up to date. Things will invariably change over time, and you’ll need to adjust your timeline accordingly.
Tasks may take longer or shorter than expected, dependencies may change, and people may be added to or removed from the project.
By updating your Gantt chart regularly, you can ensure that everyone is on the same page and that your project stays on track.
This will help you stay on top of the work that needs to be done and avoid potential problems down the road.
A Final Word on How to Use a Gantt Chart
Gantt charts are a popular project management tool, and for good reason. These handy diagrams help you to get a clear overview of your project, track the progress of your tasks, identify potential bottlenecks, and ensure that everyone is on the same page.
By seeing at a glance how each task fits into the larger picture, you can ensure that your team has everything they need to get the job done.
Perhaps best of all, Gantt charts are relatively easy to create and interpret, even for complex projects, especially if you use a tool like Office Timeline.
Overall, Gantt charts offer a number of advantages for both individuals and teams in a wide range of applications.
If you’re looking for a way to improve your project management process, consider using Gantt charts. You may be surprised at just how helpful they can be!
Have any questions about how to use a Gantt chart? Let us know by commenting below so we can help.